Everything in Brazil is enormous: its territory, the fifth largest on the planet; the largest hydrographical basin –the Amazon River and its thousands of tributaries–
covering half of the country; and its economy, the ninth most powerful in the world.
It is the world’s leading producer of coffee and sugar cane, the fourth largest of wood and one of the largest soybean producers, which attracts numerous multinational companies from the agri-food and biofuels industries; the agricultural sector represents just 5% of GDP, but it accounts for 40% of exports. Brazil also has a powerful industrial sector that contributes a quarter of GDP. It produces oil, aluminium and coal, and its textile, aeronautics, pharmaceutical, automotive, steel and chemical industries are also very important.
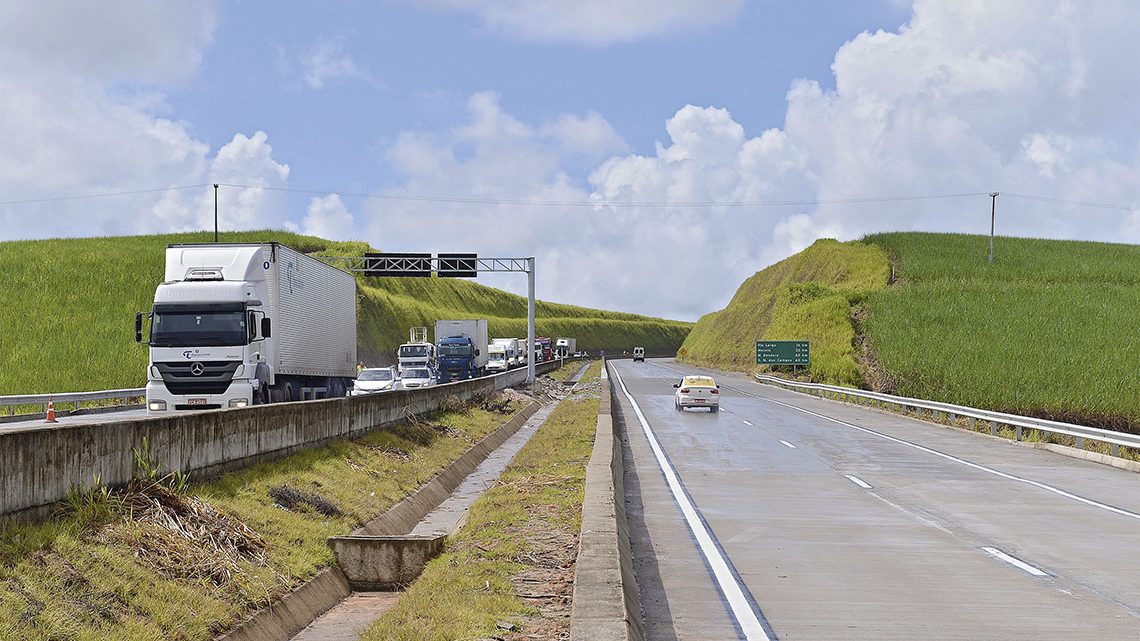
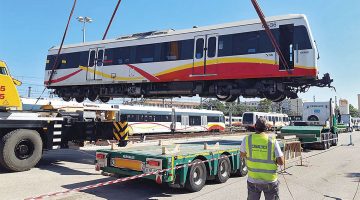
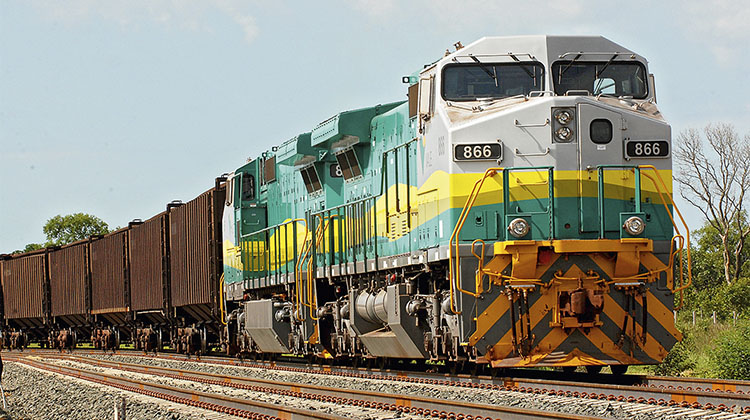
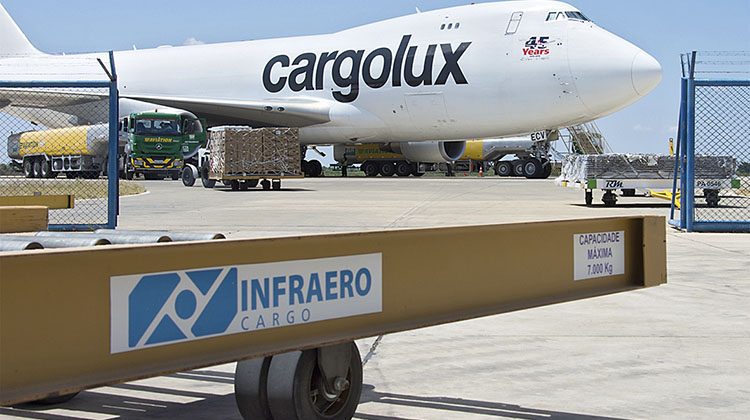
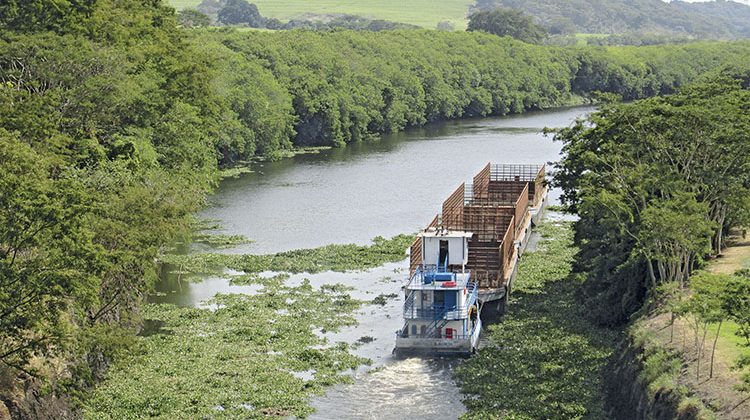
All of these goods travel through a network of 1.5 million kilometres of roads, 29,000 kilometres of railways, 32 public ports and 128 private ports, more than 4,000 airports and aerodromes and a network of 28,400 kilometres of waterways , including cabotage (coastal navigation) routes.
The federal government’s objective is to plan the considerable investment required by this immense transport network as effectively as possible in order to reduce logistics costs and thus increase the country’s competitiveness. To this end, it has launched the National Transport and Logistics Observatory (ONTL) through the public entity EPL (Empresa de Planejamento e Logistica), part of the Ministry of Infrastructure of Brazil, with which Ineco has collaborated.
Thanks to the ONTL, planners –and the general public– can consult the website www.ontl.epl.gov.br/index.php at any time for invaluable information to facilitate the decision-making process when it comes to optimising investment in infrastructure. For example, if data indicates that agricultural production, a type of large volume freight, is increasing, how can the waterway and port network be strengthened to transport it more cheaply and sustainably? And when improving the road network, in which regions has the demand for transport increased the most? How does the evolution of the country’s economy influence logistics costs?
These are just some examples of the usefulness of a transport observatory, an entity that more and more countries, including Spain, are creating, and which also collects very useful data provided by satellite tracking systems on the deforestation of the Amazon rainforest, information on fuel prices or the production of all kinds of goods, freight and passenger movements, tariffs and freight costs behaviour, average transport costs, macroeconomic indicators, etc. All of this data is provided by both large companies in the country and the different departments and public bodies of federal and state government that participate in the observatory, and is then processed and organised for easy consultation on the website.
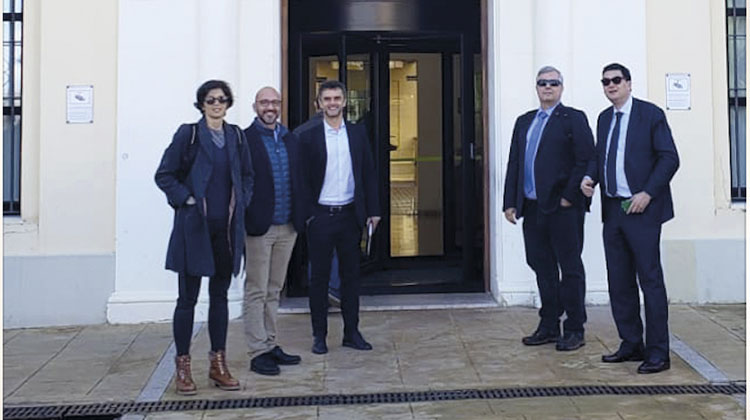
The ONTL is the result of cooperation between the governments of Spain and Brazil, which have maintained close economic relations since the 1990s, with strong investment flows between both countries. Collaboration on transport infrastructure has crystallised in the signing of multiple agreements since 2012. As a result, in 2014, Ineco carried out a study to calculate transport costs on Brazil’s waterways. With the ONTL, Ineco transmits the knowledge it has
accumulated since 2013 in the Observatory that it designed and runs for the Spain’s Ministry of Public Works.

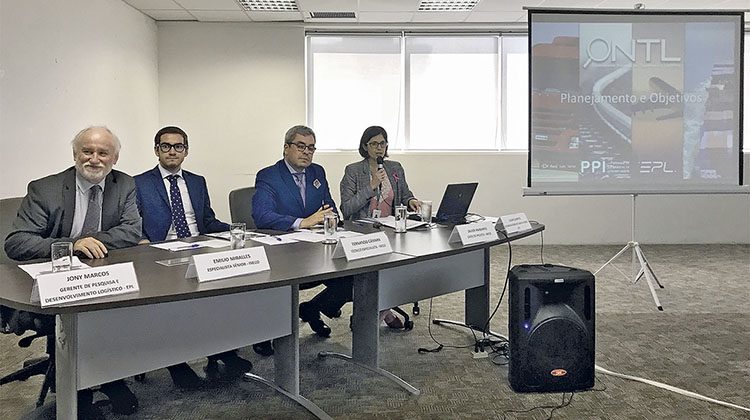
The Brazilian observatory gathers data from more than 50 sources of information supplied by numerous agents related to infrastructure, operations, security, financing and other key aspects of the Brazilian transport and logistics system: airport authorities and concessionaires, ports and roads, ministries and governmental entities, the police, merchant marine, sectoral associations and large public and private companies that represent the principal industrial sectors (oil, aeronautics, mining, automotive, etc.). All of these sources generate valuable knowledge that is disseminated in work sessions, specialised workshops and seminars, data panels, an annual newsletter, etc. and is collected on the website for consultation.
As in the case of the Spanish observatory, Ineco designed the information collection and processing system and the database and website, which is open to both sector agents and the general public. It has also developed a set of indicators which serve to harmonise data from different sources and facilitate the analysis of information and its dissemination.


